Table of Contents
Solver output is often described as a wall of colored cells — intimidating at first glance, deeply useful once you know what you're looking at. This guide breaks down every element of the 13×13 range grid: what the cells represent, how to interpret action colors and frequencies, and what it actually means when a solver tells you to mix two actions at a given ratio.
The 13×13 Grid: What Each Cell Represents
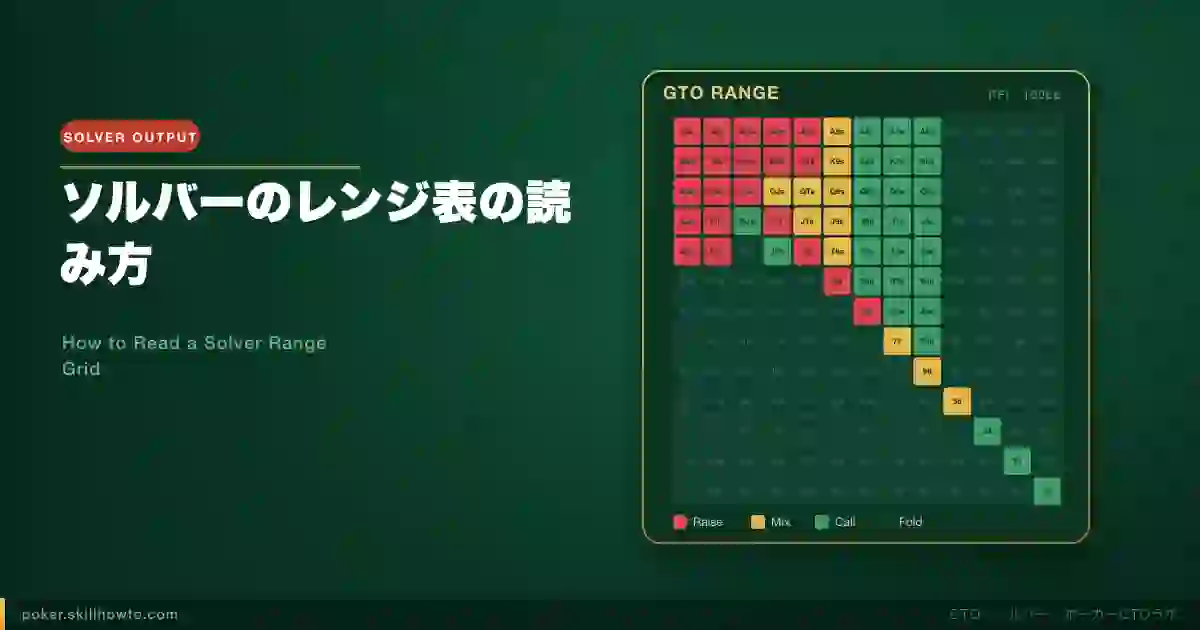
The grid that most solvers display — GTO Wizard, PioSOLVER, Simple Postflop — follows a standard layout. Rows and columns each represent one of the 13 card ranks, from Ace down to Deuce. The top-left cell is AA; the bottom-right is 22. Pocket pairs fall on the main diagonal. Cells above the diagonal are suited hands (AKs, KQs, etc.); cells below are offsuit hands (AKo, KQo, etc.).
Each cell does not represent a single hand — it represents all combinations of that hand that exist in the deck. AKo has 16 combinations (4 aces × 4 kings). AKs has 4 combinations (one per suit). Pocket pairs like QQ have 6 combinations (C(4,2) = 6). When you look at a cell's color and shading, you are looking at the average action recommendation across all live combos of that hand at that specific decision point.
Action Colors and What They Signal
- •One action at ~100% frequency
- •No mixing required
- •Examples: AA bet 100%, 72o fold 100%
- •Darker shade = higher equity / EV
- •Two or more actions recommended
- •Color proportion = action frequency
- •Both actions are EV-neutral at equilibrium
- •Boundary hands between pure regions
Every solver uses some form of color-coding to map actions. The conventions vary slightly by tool, but the underlying logic is universal:
- Solid single color: The solver recommends one action with close to 100% frequency for this hand. No mixing involved.
- Split cell / multiple colors: The solver recommends mixing two or more actions. The proportion of each color represents the recommended frequency of each action.
- Intensity / saturation: Darker or more saturated shading usually indicates higher equity or higher EV for the cell's best action. Faded cells often appear in parts of the range the solver barely reaches (low frequency of the starting hand itself).
In GTO Wizard specifically, a standard color scheme might use blue for check, green for small bet, yellow for medium bet, orange for large bet or raise, and red for jam/all-in. Always check the legend — it differs per tool and can differ per configuration. Reading the legend before studying any output is non-negotiable.
Understanding Mixed Strategies
The most counterintuitive part of solver output is the mixed strategy. When a solver says “bet 33% of the time and check 67% of the time with JTs on this board,” it does not mean you should alternate mechanically. It means both actions have essentially the same EV at equilibrium, and mixing prevents opponents from being able to exploit a predictable pattern.
In practice, you implement a mixed strategy by randomizing. Many players use the last digit of the pot size, the clock second, or a mental coin flip. The exact mechanism matters less than understanding why the mix exists:
- Pure bet: If you always bet JTs here, observant opponents know your checking range lacks strong hands and can over-bluff your checks.
- Pure check: If you always check JTs here, your bet range becomes too thin on strong value, making it easier to fold against.
- Mix: Both ranges stay balanced, keeping the opponent indifferent and unable to profitably deviate.
For studying purposes, you do not always need to execute the exact frequency. A 60/40 split vs a 70/30 split will rarely shift your EV significantly. The strategic insight is knowing which hands should be mixing at all — that tells you the key tension on the board.
Reading Frequency Numbers and EV Data
When you hover over or click into a specific cell, most solvers display granular data:
- Action frequencies: Exact percentages for each action. For example, AA on a K72r board might show: Raise 100%.
- EV (Expected Value): The chip-EV of taking the action from this node. Comparing EVs across actions shows how close the indifference really is. If check EV = 4.3bb and bet EV = 4.3bb, the mix makes perfect sense. If bet EV = 5.1bb and check EV = 3.9bb, the solver would lean heavily toward betting, not mixing.
- Equity: The raw equity of the hand against the opponent's calling/raising range at that node. High equity doesn't always mean bet — equity realization depends on position and stack depth.
A useful drill: sort hands in a range by EV, then by equity. Notice which hands have high equity but low EV (these often check back to realize equity safely) versus high EV relative to equity (these extract value by betting into capped ranges).
Nut Advantage vs Range Advantage in the Grid
One of the most instructive things you can observe in the range grid is which player holds the nut advantage at a given board. On a board like A♠K♠Q♠, the preflop raiser holds most of the nutted combinations — AKs, AQs, KK, AA — and the solver will typically show a high frequency of large bets across top pairs and above. The caller's grid will show far more mixed strategies and checking.
Flip the board to 7♣6♣5♦. Now the caller who defended a wide range often has sets, two pairs, and straights, while the raiser has overcards that miss. The caller's grid shows more betting frequency here; the raiser's grid shows more checking.
Understanding nut advantage helps you read the grid at a meta level: when you are the side with nut advantage, expect large-bet cells to populate the top of your range. When you lack it, expect a more merged, small-bet or check-heavy pattern.
Common Mistakes When Reading Solver Ranges
Several misreading errors are especially common among players new to solver study:
- Treating a mixed-strategy cell as “sometimes play, sometimes don't.” The mix is a frequency instruction, not a quality judgment. Both actions are EV-neutral at equilibrium. Don't interpret “check 40%” as “this hand is marginal.”
- Ignoring the node path. Solver output is always conditional on the action history that led to that node. A bet of 60% pot on the flop versus a bet of 60% pot on the turn represent completely different ranges. Always note the tree path at the top of the screen.
- Reading overall range color without zooming in. A range might look “mostly green (small bets)” but contain important red jam frequency on your top combos. Checking the edge of the range is as important as the center.
- Assuming all solvers agree. Different solvers, different tree abstractions, or different stack/blind configurations will produce meaningfully different grids. GTO Wizard's solutions at 100bb NL might differ from a PioSOLVER run with a simplified bet-sizing tree.
- Not checking the opponent's range simultaneously. Solver output for one street is always a reaction to the opponent's range at that same node. Read both sides together for the clearest picture.
A Practical Workflow for Studying the Grid
Rather than staring at the full grid and feeling overwhelmed, follow this sequence:
- Identify the board texture and the node (who is acting, what action has been taken).
- Scan the grid for the “pure” cells first — hands with 90%+ one action. These represent the clearest value bets, clearest checks, and clearest folds.
- Find the boundary between pure bet and mixed bet. This boundary — often around middle pair or second pair — is where the solver's indifference lies. Study these hands most closely.
- Check the nut portion of each range (top-left of the grid, strong pairs and sets). See how much frequency they bet and at what sizing. This defines the value baseline.
- Check the bottom of the range (weak pairs, high-card hands). See how often the solver bluffs these versus gives up. This defines the bluff component.
- Compare the ratio of value combos to bluff combos. On large bets, a rough 1:2 value-to-bluff ratio (by combos) keeps the opponent indifferent to calling. Verify this against what you observe.
Summary
The 13×13 range grid is the primary interface between solver computation and human understanding. Cells above the diagonal are suited hands; below are offsuit; the diagonal holds pairs. Colors represent actions; multi-color cells signal mixed strategies where both actions are EV-equal at equilibrium. When hovering on a hand, EV and frequency data reveal the depth of the solver's recommendation. The key to reading solver ranges is not memorizing outputs but understanding why the indifferences arise — that understanding transfers across boards, stack depths, and game formats far better than any isolated memorized frequency.
Related reading
This article was prepared by the Poker GTO Lab editorial team for educational purposes, drawing on widely published solver outputs, training content, and preflop charts. The ranges and frequencies shown are representative tendencies; the true optimum depends on stack depth, opponents, and table rules. This site does not promote gambling.